Rでテキストマイニングをやってみた(9)いろいろクラスタリング
こんにちは。前回のクラスタリングをやってみて、用いる距離を変えてみたり、クラスタリングの方法を変えてみたらどうなるのか、とても気になってしまいました。
そんなこんなで、手当たり次第試してみることにします。
さまざまな距離
以前、さまざまな距離についての記事を投稿したら、PVが増えたことがありました。
その記事のリンクをはることで、今回は距離についての説明は割愛します。
この頃は、こんなにちゃんと図を作って、しっかり記事を書いていたんだ・・・PVが伸びるよな・・・
と反省してみます。
R でこれらの距離を求めていなかったので、どのような距離を求められるか help を見て調べてみました。
Details
Available distance measures are (written for two vectors x and y):euclidean:
Usual distance between the two vectors (2 norm aka L_2), sqrt(sum((x_i – y_i)^2)).maximum:
Maximum distance between two components of x and y (supremum norm)manhattan:
Absolute distance between the two vectors (1 norm aka L_1).canberra:
sum(|x_i – y_i| / (|x_i| + |y_i|)). Terms with zero numerator and denominator are omitted from the sum and treated as if the values were missing.This is intended for non-negative values (e.g., counts), in which case the denominator can be written in various equivalent ways; Originally, R used x_i + y_i, then from 1998 to 2017, |x_i + y_i|, and then the correct |x_i| + |y_i|.
binary:
(aka asymmetric binary): The vectors are regarded as binary bits, so non-zero elements are ‘on’ and zero elements are ‘off’. The distance is the proportion of bits in which only one is on amongst those in which at least one is on.minkowski:
Documentation for package ‘stats’ version 3.6.1
The p norm, the pth root of the sum of the pth powers of the differences of the components.
うーん、前の記事に書いていない距離もあるし、どうしよう・・・
今回は、距離の求め方とクラスタリングの方法の違いで結果がどの程度異なるかを調べることが目標なので、気にしないことにしよう!
ということで、これらの距離を使っていきます。(先ほどの反省はどこへ・・・?)
さまざまなクラスタリングの方法
クラスタリングをする関数 hclust の help を見てみます。
Arguments
Documentation for package ‘stats’ version 3.6.1
method
the agglomeration method to be used. This should be (an unambiguous abbreviation of) one of “ward.D", “ward.D2", “single", “complete", “average" (= UPGMA), “mcquitty" (= WPGMA), “median" (= WPGMC) or “centroid" (= UPGMC).
クラスタリングの方法として、"ward.D", “ward.D2", “single", “complete", “average", “mcquitty", “median", “centroid" というものがあるようです。
これらについて説明が書かれたページがあったので、リンクをはっておきます。
さまざまなパターンを試してデンドログラムを描いてみる
それでは、さまざまなパターンでデンドログラムを描いてみることにします。
その際のプログラムは次になります。
library(RMeCab)
library(ggdendro)
novel<-docMatrix2(choose.dir(),pos=c("名詞","動詞","形容詞"),weight="tf*idf*norm")
novel2<-t(novel)
dis<-dist(novel2,method = "euclidean")
hc<-hclust(dis,"ward.D2")
ggdendrogram(hc,rotate=TRUE)
このプログラムで、5 行目の euclidean と、6 行目の ward.D2 をいろいろ変えてデンドログラムを描いていきます。
これ以降はひたすらデンドログラムを載せていきます。
はじめに距離の取り方はユークリッド距離、クラスタリングの方法を変えてみることにします。
euclidean × ward.D2
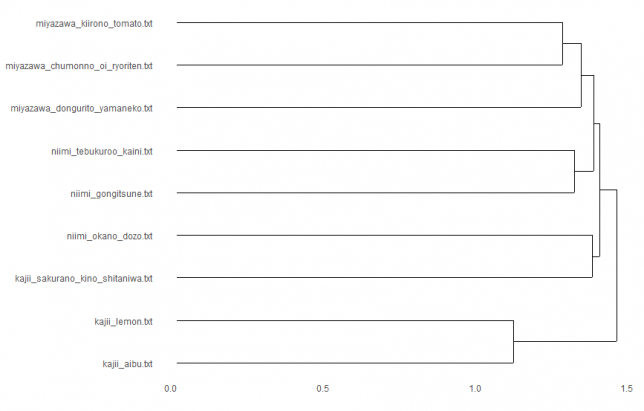
euclidean × single
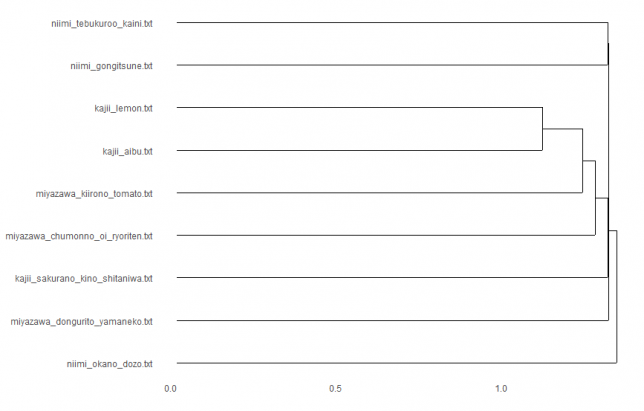
euclidean × complete
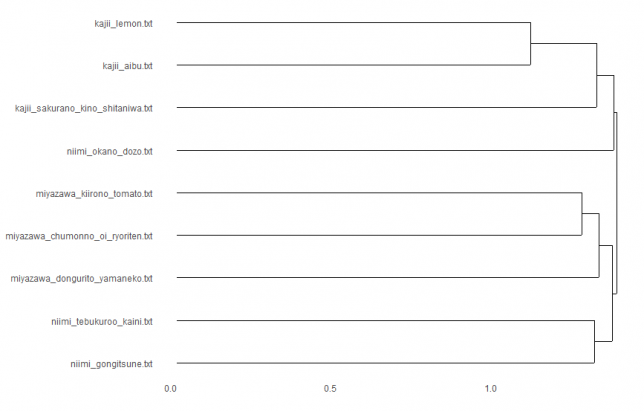
euclidean × average
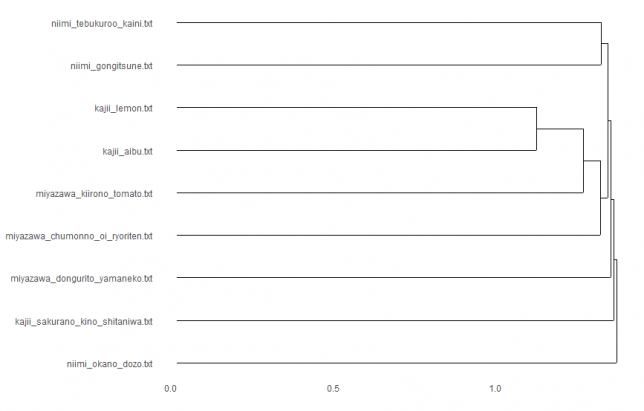
euclidean × mcquitty
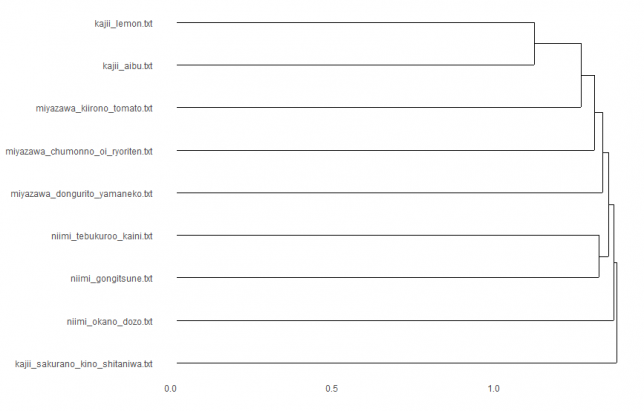
euclidean × median
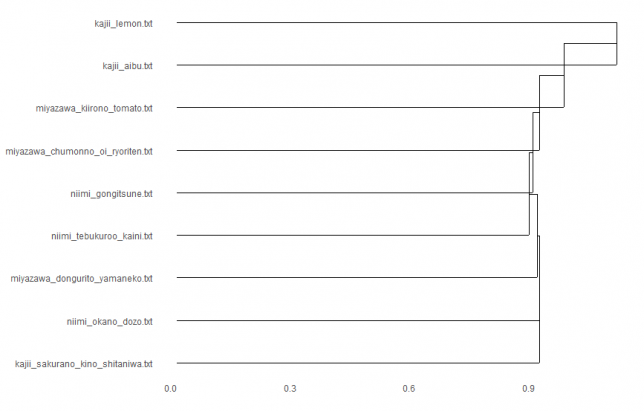
?不思議な形になった・・・?
euclidean × centroid
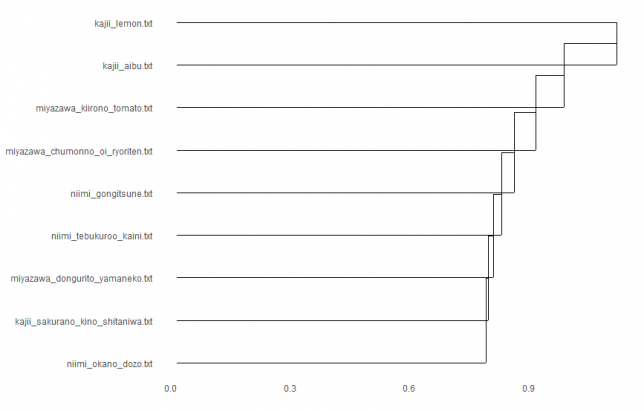
すべて距離の求め方はユークリッド距離によるものですが、どの点に注目してクラスタリングしていくかによって、クラスターのでき方が異なっていますね。
euclidean × ward.D2
次に、クラスタリングの方法を ward.D2 に固定し、距離の取り方を変えてみます。
ユークリッド距離の場合は上でも掲載していますが、再掲します。

maximum × ward.D2
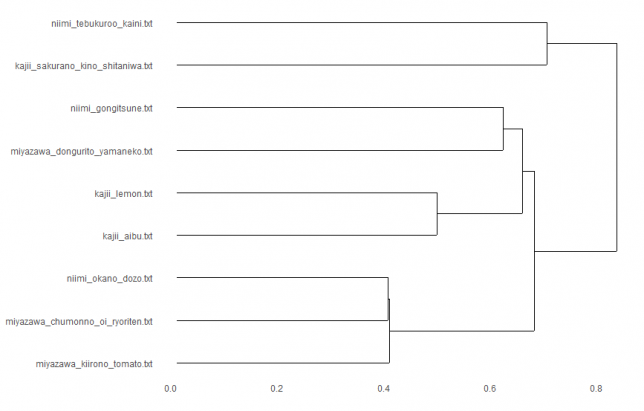
manhattan × ward.D2
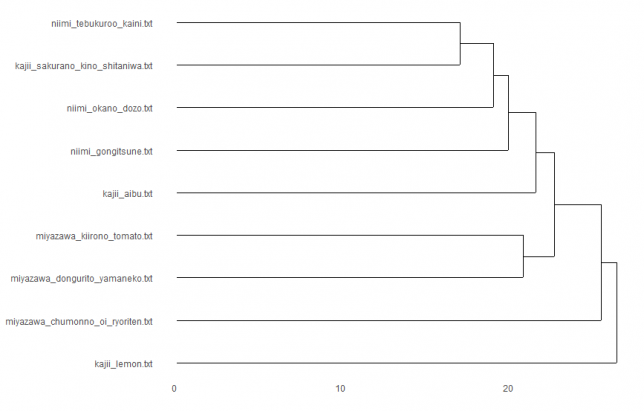
canberra × ward.D2
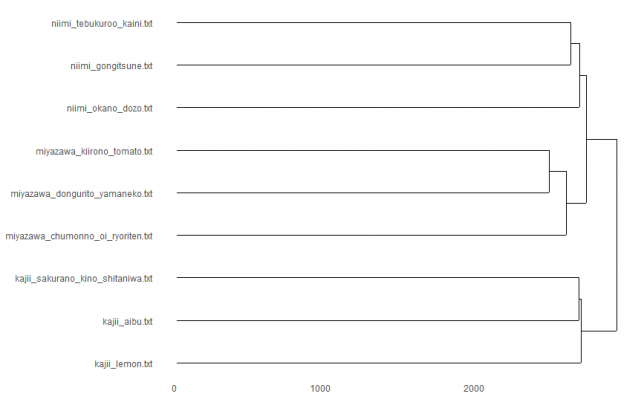
おや!作者ごとにまとまったよ!
binary × ward.D2
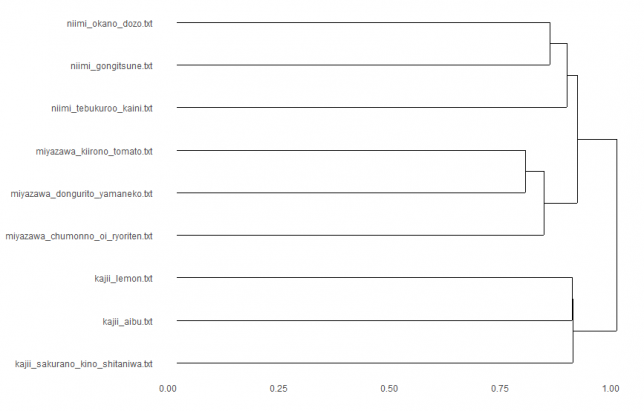
おおお!またまた作者ごとにまとまったよ!
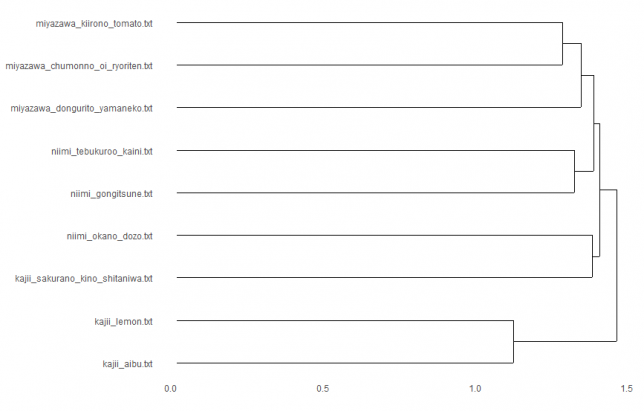
minkowski × ward.D2
おわりに
以上、ユークリッド距離に固定してクラスタリングの方法を変えてみることと、クラスタリングの方法をウォード法に固定して使う距離を変えてみることをやってみました。
作者ごとにまとまるとは全く思っていなかったのですが、予想外に作者ごとにまとまる場合がありました。
キャンベラ距離×ウォード法、バイナリー距離×ウォード法の2つの組み合わせで作者ごとにまとまったのですが、この方法が妥当なのか否かは、とても怖くて断定できません。
また、うまくいった理由を検証してみる必要はあるのかと思いますが、ここだけに深入りするのはやめておきます。
今回はこれでおしまいにします。それではまた。



ディスカッション
コメント一覧
まだ、コメントがありません